Imagine having the ability to effortlessly clean, visualize, and analyze data, all through simple, plain English instructions. Yes, you can use ChatGPT for data analysis! This dream has become a reality with ChatGPT’s revolutionary Advanced Data Analysis feature, available in ChatGPT 4. In this article, we’ll delve into how ChatGPT’s Advanced Data Analysis can help you make data manipulation, analysis, and visualizations by testing the future on multiple datasets.
What exactly is Advanced Data Analysis in ChatGPT?
ChatGPT’s Advanced Data Analysis is a game-changer when aiming to master data analysis. This feature, available in ChatGPT 4, simplifies the task of data handling, eliminating the need for coding in Python or R (or other languages used for data analysis). You can effortlessly instruct ChatGPT in plain English to clean and visualize data, making complex projects or data analysis for your thesis way more approachable. You can even create detailed reports in Word format for their assignments with this feature. In short, the Advanced Data Analysis feature empowers you, regardless of your coding proficiency, to understand and manipulate data more effectively.
Using the tool
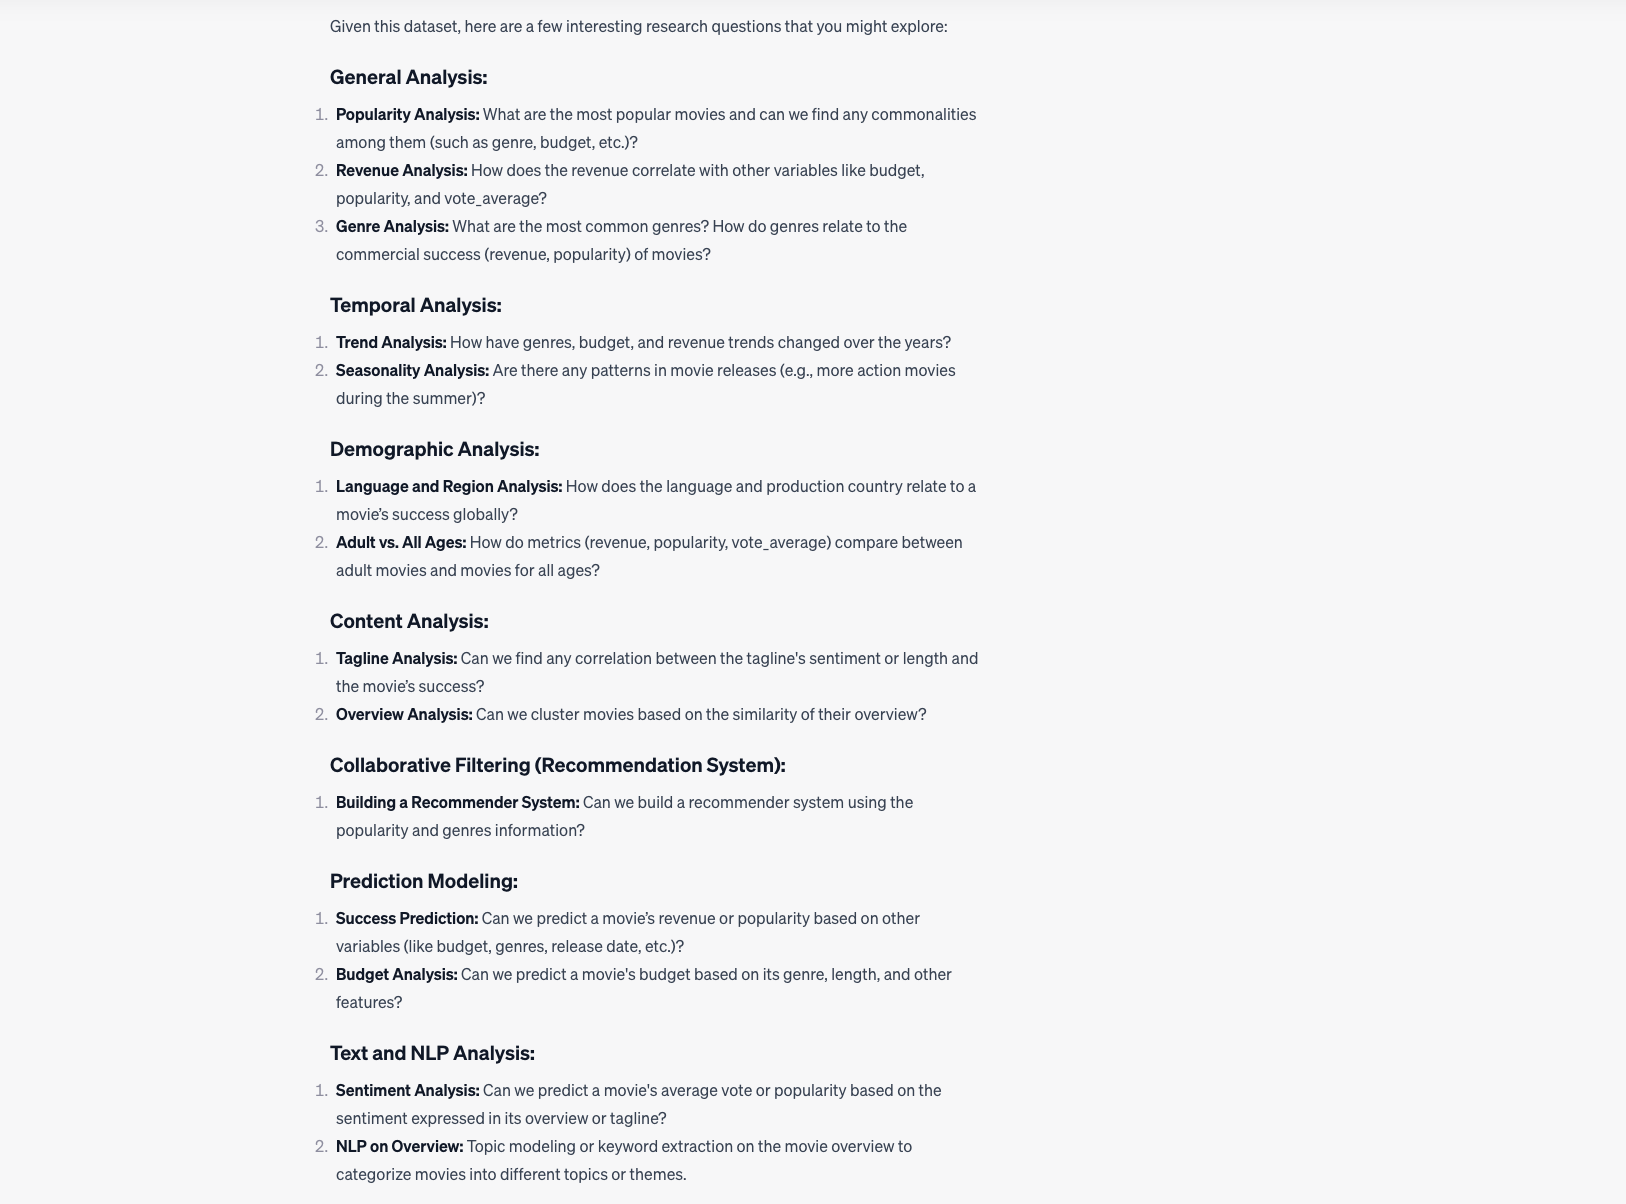
We can showcase how powerful this tool actually is with an example dataset. Let’s say we have a dataset on over 45,000 movies with 26 million ratings from over 270,000 users (available on Kaggle). If you do not know where to start your analysis ChatGPT can also brainstorm for you and tell you all the possibilities of analysis.
The example below shows how ChatGPT can help you on ideas about what research questions to ask about your dataset. ChatGPT returns a very long detailed list about all the possible analysis you can do on your dataset.
Prompt Output

You can start by asking ChatGPT what the dataset is about to get to know the data. ChatGPT will then give you a detailed overview of all the columns in the dataset and explain what kind of information is in it.
After obtaining a detailed overview of the dataset, you can ask ChatGPT to generate visualizations such as histograms, scatter plots, or box plots to gain a better understanding of the distribution and relationships within the data.
Prompt
Give me a graph with a distribution of the daily cigarettes smoked
Output
One important thing to do in your data analysis is to detect outliers in your data. In the distribution above we see some pretty high values for the number of daily cigarettes smoked, which is a seemingly impossible number of cigarettes to smoke on one day, I hope most of us can agree on. We can ask ChatGPT to identify the outliers. You can see below that ChatGPT uses the IQR method to identify outliers.
Prompt
Can you show me all the outliers in this dataset?
Output
Disclaimer: always be sure to check for yourself if outliers can really be deleted without creating any biases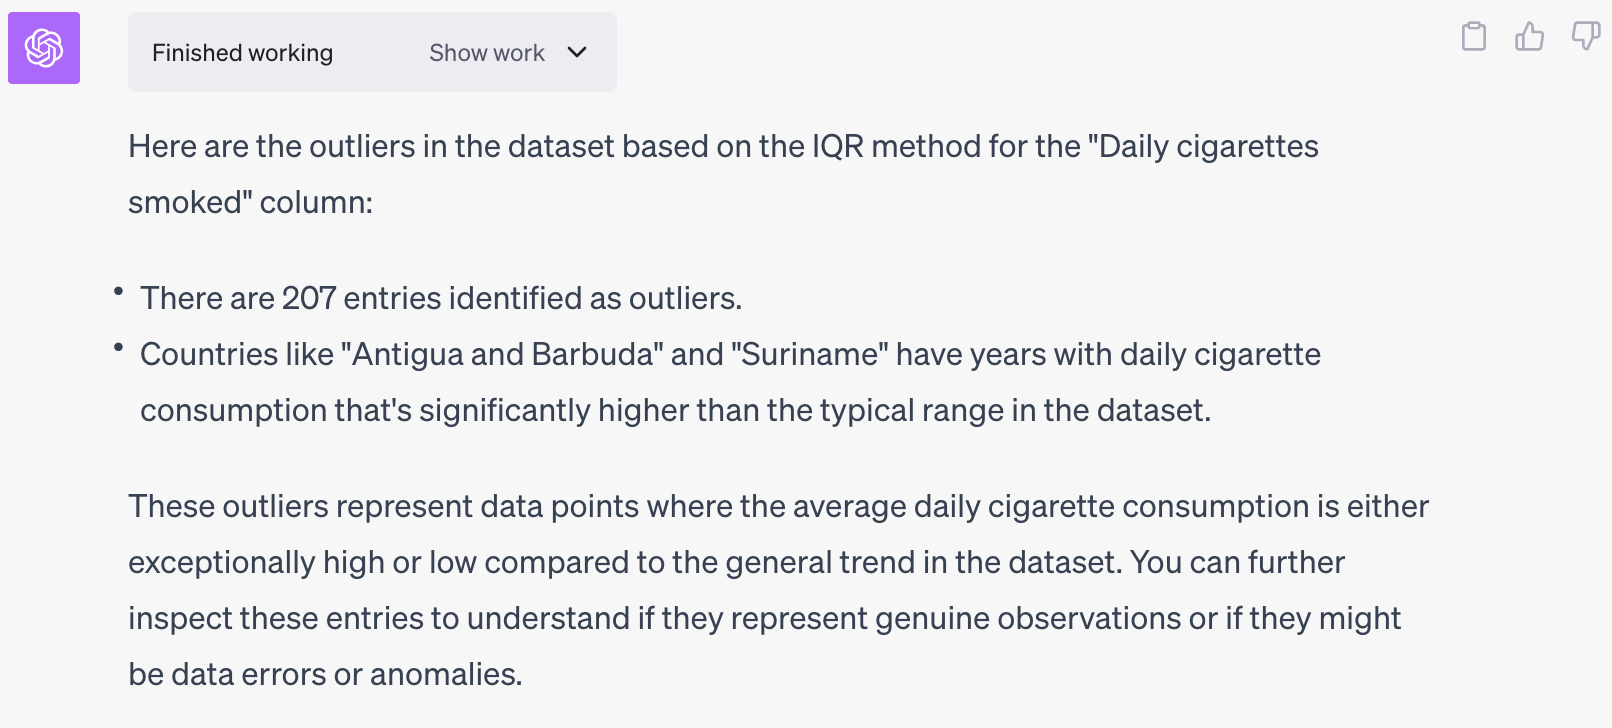
How to see what ChatGPT did in the background?
Above every output ChatGPT gives you can click on the ‘Show work’ button to reveal what ChatGPT did in the background to come to the given output. This allows you to understand the reasoning and steps taken by ChatGPT to arrive at a particular output. It provides transparency and helps you verify the accuracy of the information provided by ChatGPT.
Example
How to enable the tool?
Unfortunately, this feature is only available for ChatGPT plus subscribers. With the premium version, Advanced Data Analysis or Code Interpreter features are automatically enabled when initiating a new chat. It’s important to note that you must start a new chat using the GPT-4 model, as the GPT-3.5 model lacks data analysis capabilities. The image below illustrates the screen you should see once your premium account is correctly set up. To begin uploading your own datasets, simply click the “+” button located in the bottom left corner after opening a new chat.


