
As a student, you often come across interesting data on the internet and wonder, “How can I use this data for my project, assignment, or research?” Frequently, this data isn’t easily copy-pastable, or when you do copy it, it appears in an unusable format. Instead of dealing with these time-consuming and frustrating problems, you can ask AI to handle the task by specifying exactly what you need.
This article will show you how to go through the entire process: starting with raw data, using ChatGPT to convert it into a usable format, and then creating a visualization, with the code provided in R. This can also be done in Python, MATLAB, or Stata, or you can even request a visualization directly without any coding.
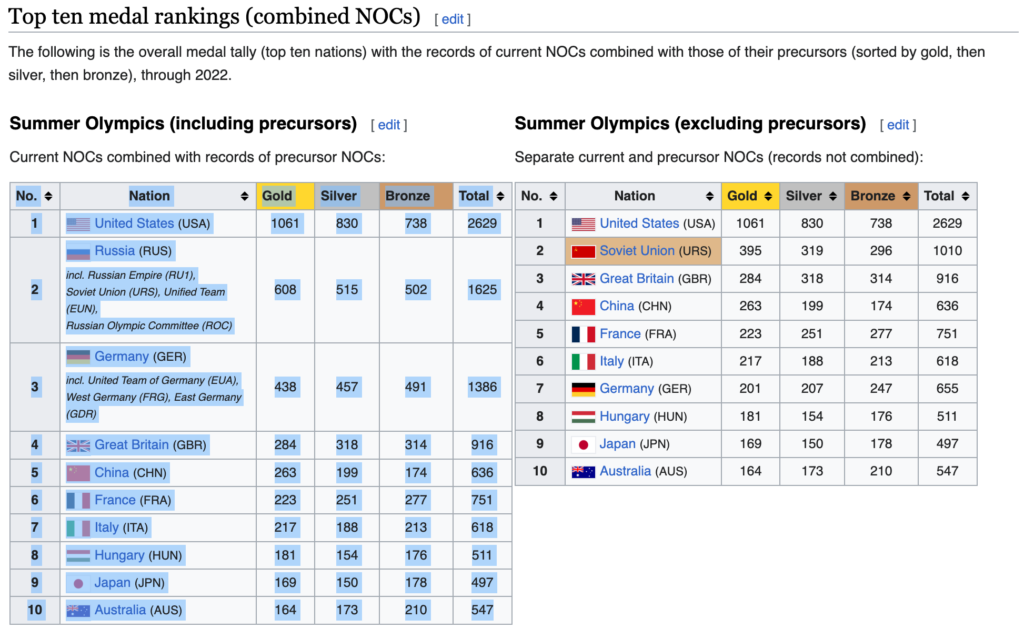
For our example, we’ll keep it simple by using the “All-time Olympic Games medal table” from Wikipedia. However, the techniques covered here can be applied to almost any web data you want to extract. We encourage you to be creative and explore the possibilities!
From Extracting to Visualizing Data: A Simple AI Approach
Step 1: Extracting your data
Start by Finding the Right Data: First things first, locate the data you want to use. In our example, we’re looking at the “All-time Olympic Games medal table” on Wikipedia, However, you could apply this approach to any data you find online, such as survey results, economic statistics, or historical records.
The way you phrase your request to ChatGPT matters a lot. To achieve the best outcome, be clear and specific about your requirements. Instead of a vague prompt like “Get the data from the Olympic table,” use a more detailed one with placeholders to steer ChatGPT in the right direction:
Extract the data [Specify where ChatGPT can find it] and format it into a [desired output format] that includes columns for [list of columns or fields].“ DATA “
For Our Example
ChatGPT, please extract the data delimited by three backticks and format it into a CSV file that includes columns for Nation, Gold, Silver, Bronze, and Total Medals.“ COPY YOUR DATA HERE “
Breaking Down the Prompt Elements:
- [data + location]: This is where you specify the exact location or description of the data. Be as specific as possible to help ChatGPT understand exactly where to look for the data.
- [desired output format]: Here, you tell ChatGPT what format you want the extracted data in. Common formats include:
- CSV (Comma-Separated Values): Ideal for tabular data that you want to analyze in software like Excel, Google Sheets, or any data analysis tool.
- JSON (JavaScript Object Notation): Useful if you’re working with APIs or need the data for web development.
- Plain Text or Markdown: Suitable for simple text outputs, such as summaries or lists.
In our example, we chose a CSV file because it’s a standard format for organizing tabular data.
- [list of columns or fields]: This part defines the specific data points or fields you want to extract. Providing a detailed list helps ChatGPT know exactly what to look for. For instance:
- Nation, Gold, Silver, Bronze, Total Medals: In our example, these are the columns from the Olympic Games medal table we want to extract.
If you want more tips on how to write better prompts, check out our post on the art of prompting.
Why This Structured Prompt Works:
- Clarity: The placeholders make your request explicit, reducing ambiguity and now ChatGPT knows precisely what you want.
- Specificity: By detailing the desired output format and fields, you steer ChatGPT to produce a response that meets your exact needs, minimizing back-and-forth adjustments.
- Flexibility: Using placeholders allows you to quickly adapt the prompt for different data sources and formats. Simply swap out the text within the brackets to customize your request.
For ChatGPT Plus users, make it easier on yourself by simply taking a screenshot of the data instead of copy-pasting. The file upload system allows for image recognition.
Step 2: Cleaning Your Data
Now that you’ve got the data extracted, the next step is to bring it into R or any programming language you want (or just ask for a visualization), where you can start analyzing and visualizing it. ChatGPT can help you generate the R code needed to do this quickly and efficiently, even if you’re not familiar with the coding language or are a coding expert.
Start with a Clear Prompt: It might be redundant to state, and repetitive. But start again with a clear prompt. Ask ChatGPT to convert the extracted data into an R data frame, which is the basic structure for storing data in R. Here’s an example of a prompt that does just that:
ChatGPT, I need an R script to work with the CSV file [describe the data or file, e.g., “containing the Olympic Games medal table”]. Follow best practices, such as [best practice, e.g., “setting the working directory correctly”], and perform the necessary steps, like [action, e.g., “using read.csv to load the data and convert it into a data frame”]. Additionally, handle any common issues, such as [potential issues, e.g., “missing values or incorrect data types”], and provide [additional instructions, e.g., “any tips or steps to ensure the data is ready for analysis”].
Again our example:
ChatGPT, please generate an R script that reads the previously extracted “All-time Olympic Games medal table” data from the CSV file, loads it into R, and converts it into a data frame. Include steps for setting the working directory, using read.csv for loading the data, and handling potential issues like missing values and incorrect data types.
Why These Steps Matter: Following best practices for data loading and conversion helps make sure your data is properly imported, clean, and ready for analysis. Even if these steps feel repetitive, they are important if you want to learn some programming, understand the actions ChatGPT took, or need to repeat the analysis later. This reduces errors and makes it easier to handle larger or more complex datasets.
Quick Tip: Always check the code that ChatGPT provides. Look at each step to understand what it does, especially if you’re new to programming. This helps you catch any mistakes early and learn how the code works.
Step 3: Visualizing Your Data
Now that your data is clean and ready, it’s time to visualize it! As you might have guessed: ChatGPT can help you generate the R code needed to create different types of plots and graphs.
General Prompt Template for Visualization: When requesting ChatGPT’s help with visualizations, make sure your prompt is detailed and includes specific instructions. Here’s a flexible template:
Create an R script using [library, e.g., “ggplot2”] to generate a [type of plot, e.g., “bar plot”] that visualizes [what to plot, e.g., “total medals by country”]. Make the plot in [order, e.g., “ordered by total medals in descending order”], with [what on the axes, e.g., “countries on the x-axis and total medals on the y-axis”]. Include [additional plot elements, e.g., “labels, a title, color coding for each country, and a legend”].
Now, building on what we did in Step 2:
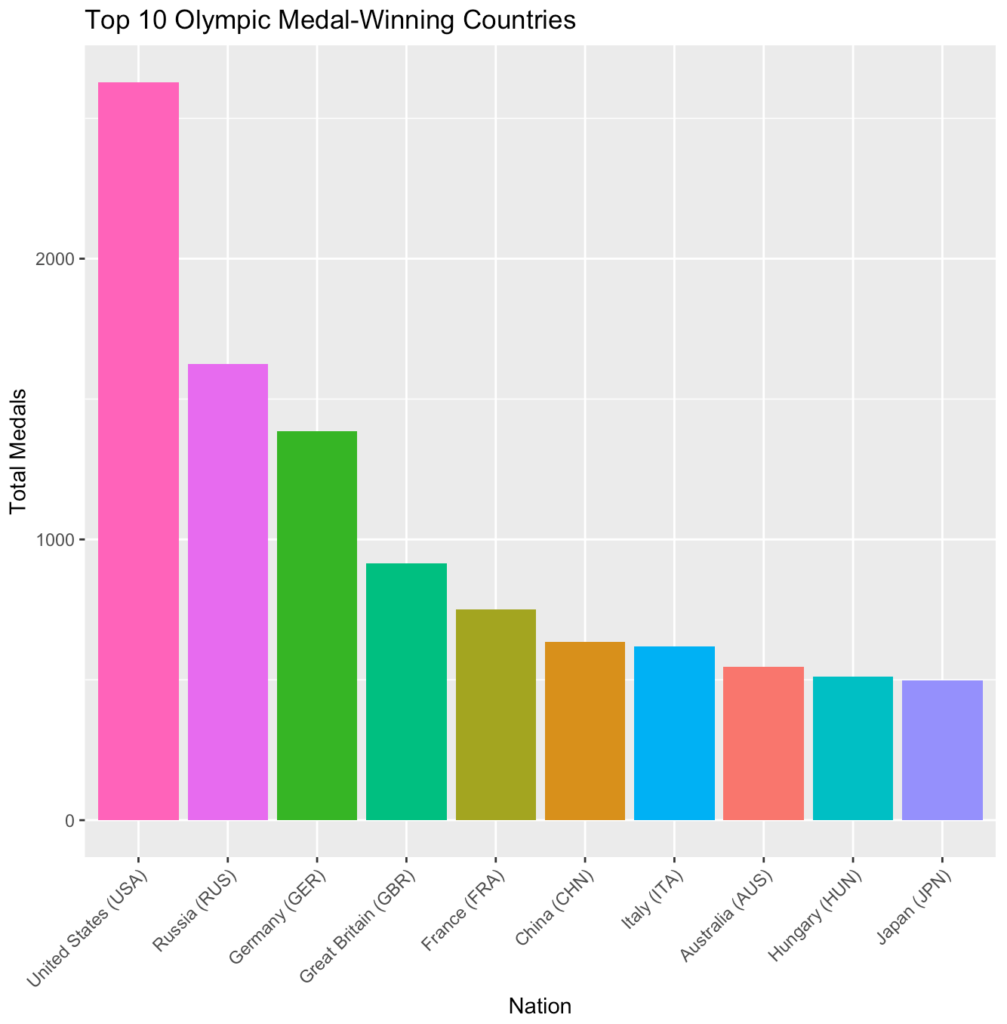
Create an R script using ggplot2 to generate a bar plot that visualizes the total Olympic medals by country. Make sure the plot is ordered by total medals in descending order, with countries on the x-axis and total medals on the y-axis. Include labels for the axes, a title (“Top 10 Olympic Medal-Winning Countries”), and color coding for each country without a legend.
Quick Tip: Don’t be afraid to experiment with different types of plots and settings. ChatGPT can provide various options, so try out a few to find the most effective visualization for your data.
# Load the ggplot2 library
library(ggplot2)

# Create a bar plot
ggplot(df, aes(x = reorder(Nation, -Total), y = Total, fill = Nation)) +
geom_bar(stat = "identity") +
labs(title = "Top 10 Olympic Medal-Winning Countries", x = "Nation", y = "Total Medals") + theme(axis.text.x = element_text(angle = 45, hjust = 1)) +
scale_fill_discrete(guide = FALSE) # Remove legend
This code will create a bar plot showing the total medals won by each of the top 10 Olympic medal-winning countries, with the countries sorted by the total number of medals in descending order. Adjust the plot aesthetics and labels to suit your analysis and presentation preferences.
Are you working with Python? Just specify the Python language in your prompt to ChatGPT, and that’s it!
Copy the prompt and ChatGPT’s response, and that’s it. You have created a neatly formatted data frame in R and subsequently created a visualization with your analysis.
Thinking Bigger: What You’ve Learned and What’s Next
We’ve shown how you can use ChatGPT to handle data tasks, from pulling data off the web to creating visuals—all without needing to know much code. This makes working with data faster and more approachable.
What You Can Try Next:
- Build Coding Skills: Learn by doing. Understand the scripts that ChatGPT provides and try modifying them yourself.
- Make Visuals Fast: Generate charts or graphs for your assignments or presentations.
- Do Quick Data Checks: Use ChatGPT to look for patterns or interesting points in your data.
- Try Different Plots: Test out various graph types to see which best shows your data story.