Welcome to our tutorial on using the ChatGPT Code Interpreter. This extension allows ChatGPT to use Python, a widely used programming language for data analysis. Now you can upload data files, perform data analysis inside the chat interface, and then download the new file. Therefore, you can perform a Data Science project without writing a single line of code but with sole usage of natural language.
In this article, we will work through every step of your data project using the ChatGPT Code interpreter, from data cleaning to analysis and visualizations. We will start with an uncleaned dataset, and we will end up with a full report including visualizations. While of course, we will be working through a specific example, you will be equipped with the skill of combining Python’s analytical capabilities with ChatGPT’s interface after this tutorial.
One remark, make sure to always double-check the code generated by ChatGPT, as it may not always be correct.
The Basis
Prompt Formula
A well-structured starting prompt is the key to a successful interaction with the chat model, therefore will will discuss in this section a template prompt.
First, assign a role to the AI. This is important because assigning a role to the system results in more targeted output. For example, in our scenario discussed later, we “talk” to a data analyst, which is much better for working with data than interacting with someone without computer experience.
Next, we specify additional information. What are the tasks we will pass on to our data analyst, and his/her specific intrsructions.
At last, The System Level Strict Boundary Setting, this requires some explanation. Essentially, these are overarching rules or constraints that ChatGPT must adhere to at a system level. For example, “Stick to providing factual information only.” Similarly, a Task Level Strict Boundary Setting sets a specific constraint or rule related to the task. For example, “Do not include any external links.” or “Avoid using first-person pronouns”.
Starting Prompt
Act as {THE ROLE YOU ASSING TO CHATGPT}. You are performing {WHAT YOU WANT CHATGPT TO DO}. {System Level Strict Boundary Setting}.
1. {Requirement 1}
2. {Requirement 2}
3. {Requirement 3}
4. {Requirement 4}
6. {Requirement 5}
7. {Task Level Strict Boundary Setting #1}
8. {Task Level Strict Boundary Setting #2}
{More Context}
Prompt Techniques
When using ChatGPT for cleaning your data, it’s important to be clear and specific in your instructions. This helps ChatGPT respond accurately and relevantly. Any degree of ambiguity can lead to incorrect effects on your data.
Thus, make sure there is no ambiguity in what your intentions are. For example, for simple tasks like renaming columns. State which column you want to rename and what the new column name should be. For example, “Rename the column old_column_name to new column name.” This specific prompt leaves no room for interpretations and specifies a clear task.
Similarly for filtering daa, describe the specific conditions on which the data is filtered. For example, “Filter the data in the age column to keep only rows where the value is greater than 30.” This prompt specifies the column and the filter condition.
When you want to combine multiple steps in one prompt, such as replacing values and then filtering data, clearly mention each separate step. For example: “Replace all NA values in the Column_name’ column with Unkown. Then filter the data in the column_name column to keep only rows where the values are Unknown. By describing the steps separately, you make it easier for ChatGPT to perform the correct operations.
Another approach is to make use of placeholders, such as <> or as in our prompt template {}. While ChatGPT can work through your text approach for multiple steps as discussed above, this clearly indicates to ChatGPT where one task starts, and ends. Thereby, structuring the response accordingly. This practice we used in our basic prompt.
Want to learn more about prompts and how to effectively write them for your studies? Check out our free course on prompt engineering!
Using ChatGPT for every step in your Data Project
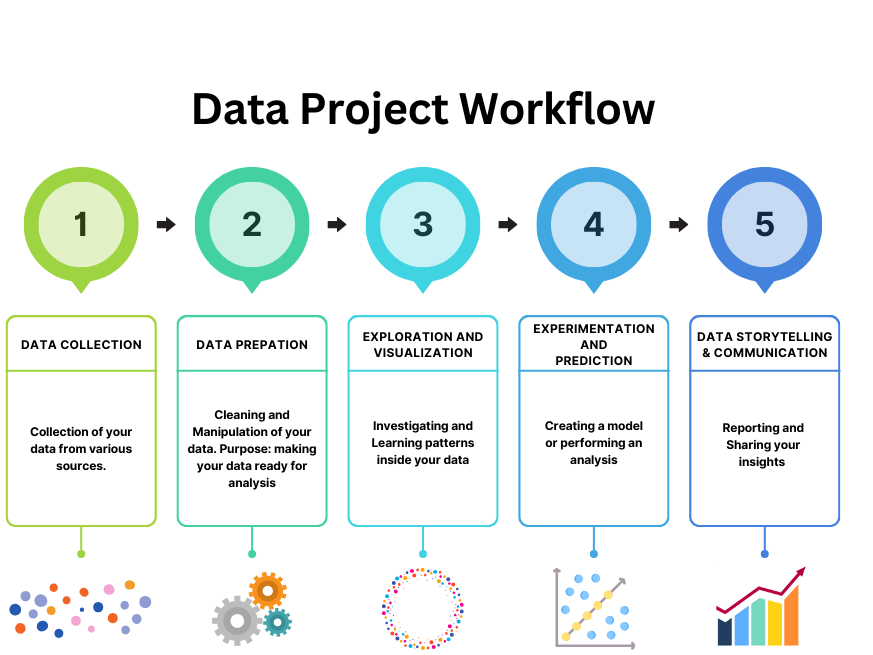
Data Cleaning and Preparation
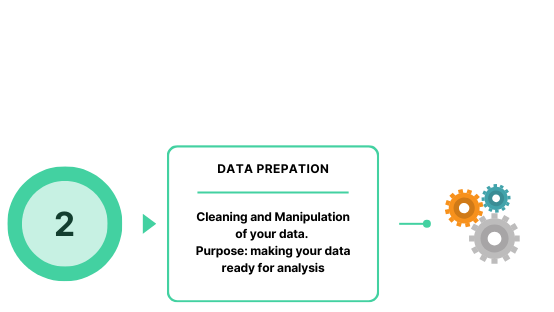
Data cleaning and preprocessing are the initial steps in any data project and are therefore fundamental for a successful project. It’s uncommon to find completely ‘clean‘ data. ChatGPT, equipped with the Code Interpreter extension, can assist you during the first step in your data project.
This part consists of a variety of steps, for a structured approach consider the following approach:
- Start with requesting a summary of the dataset to identify the extent and the nature of the issues. Think about specifying missing values, outliers, data type inconsistencies, etc. Ask the data analyst to prioritize the issues based on their impact.
- Next, ask for a detailed quantification of problems per column. This can include the number of missing values or the degree of outliers.
- After that, request suggestions for strategies to address the identified problems. This would be in line with previous examples, considering multiple approaches for missing values, outliers, or data inconsistencies.
- Finally, Define the actions based on your preferred strategy.
Example Case
Starting Prompt
Act as a data analyst. You are performing data analysis on the PIAAC dataset. Perform the following tasks:
< Provide a simple description of the columns in this dataset >
< Identify data cleaning issues and surface them to me >
< Do not perform any data cleaning tasks without further instruction >
< Identify other ways we can improve the quality of the dataset >
The prompt above is the basis for our interaction with the Code Interpreter. We start the conversation with the prompt above, of course you can adjust the prompt for your specific purposes. After that, you can begin cleaning the data based on the AI model’s response.
Iterations
Prompts we have used to clean the data:
- First, let’s tackle the missing values. Could you show me the number of missing values in each column?
- Potential Prompt: Which strategies can I use for handling missing values?
- Our Iteration: remove the rows with missing values of the earnhr variable
- Proceed to convert the categorical values. For the `gender_r` column, assign Male as 1 and Female as 0. Set the default value for `Computerexperience` to 1. Similarly, set the default value for `Native speaker` to 1. For the `edlevel3` column, categorize the levels as low < medium <high.
- Scale the phys, plan, infl, problem and rcog variables. So that they have a mean of 0 and a sd of 1.
- When it comes to handling outliers, I need you to focus on the earnhr column. Can you suggest appropriate strategies for dealing with these outliers? Please wait for further instructions before taking any action.
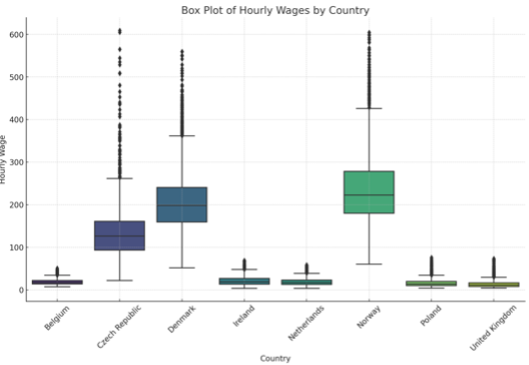
- Examine the distribution of hourly wages in the data. What do you observe?
- Remove outliers, to remove the top 1% and bottom 1% of observations in terms of hourly wages. Do this separately for each country in the data.
Our tip is, when you get the first output from ChatGPT, press the blue button at the end of the output. This will display the code used by ChatGPT. You can now copy this into your IDE. More importantly, you can check if ChatGPT has followed your instructions. Make it easier for yourself by pressing the button with Always display details.
Next, we add other variables to the dataset:
- Create a new column with a log transformation of the earnhr.
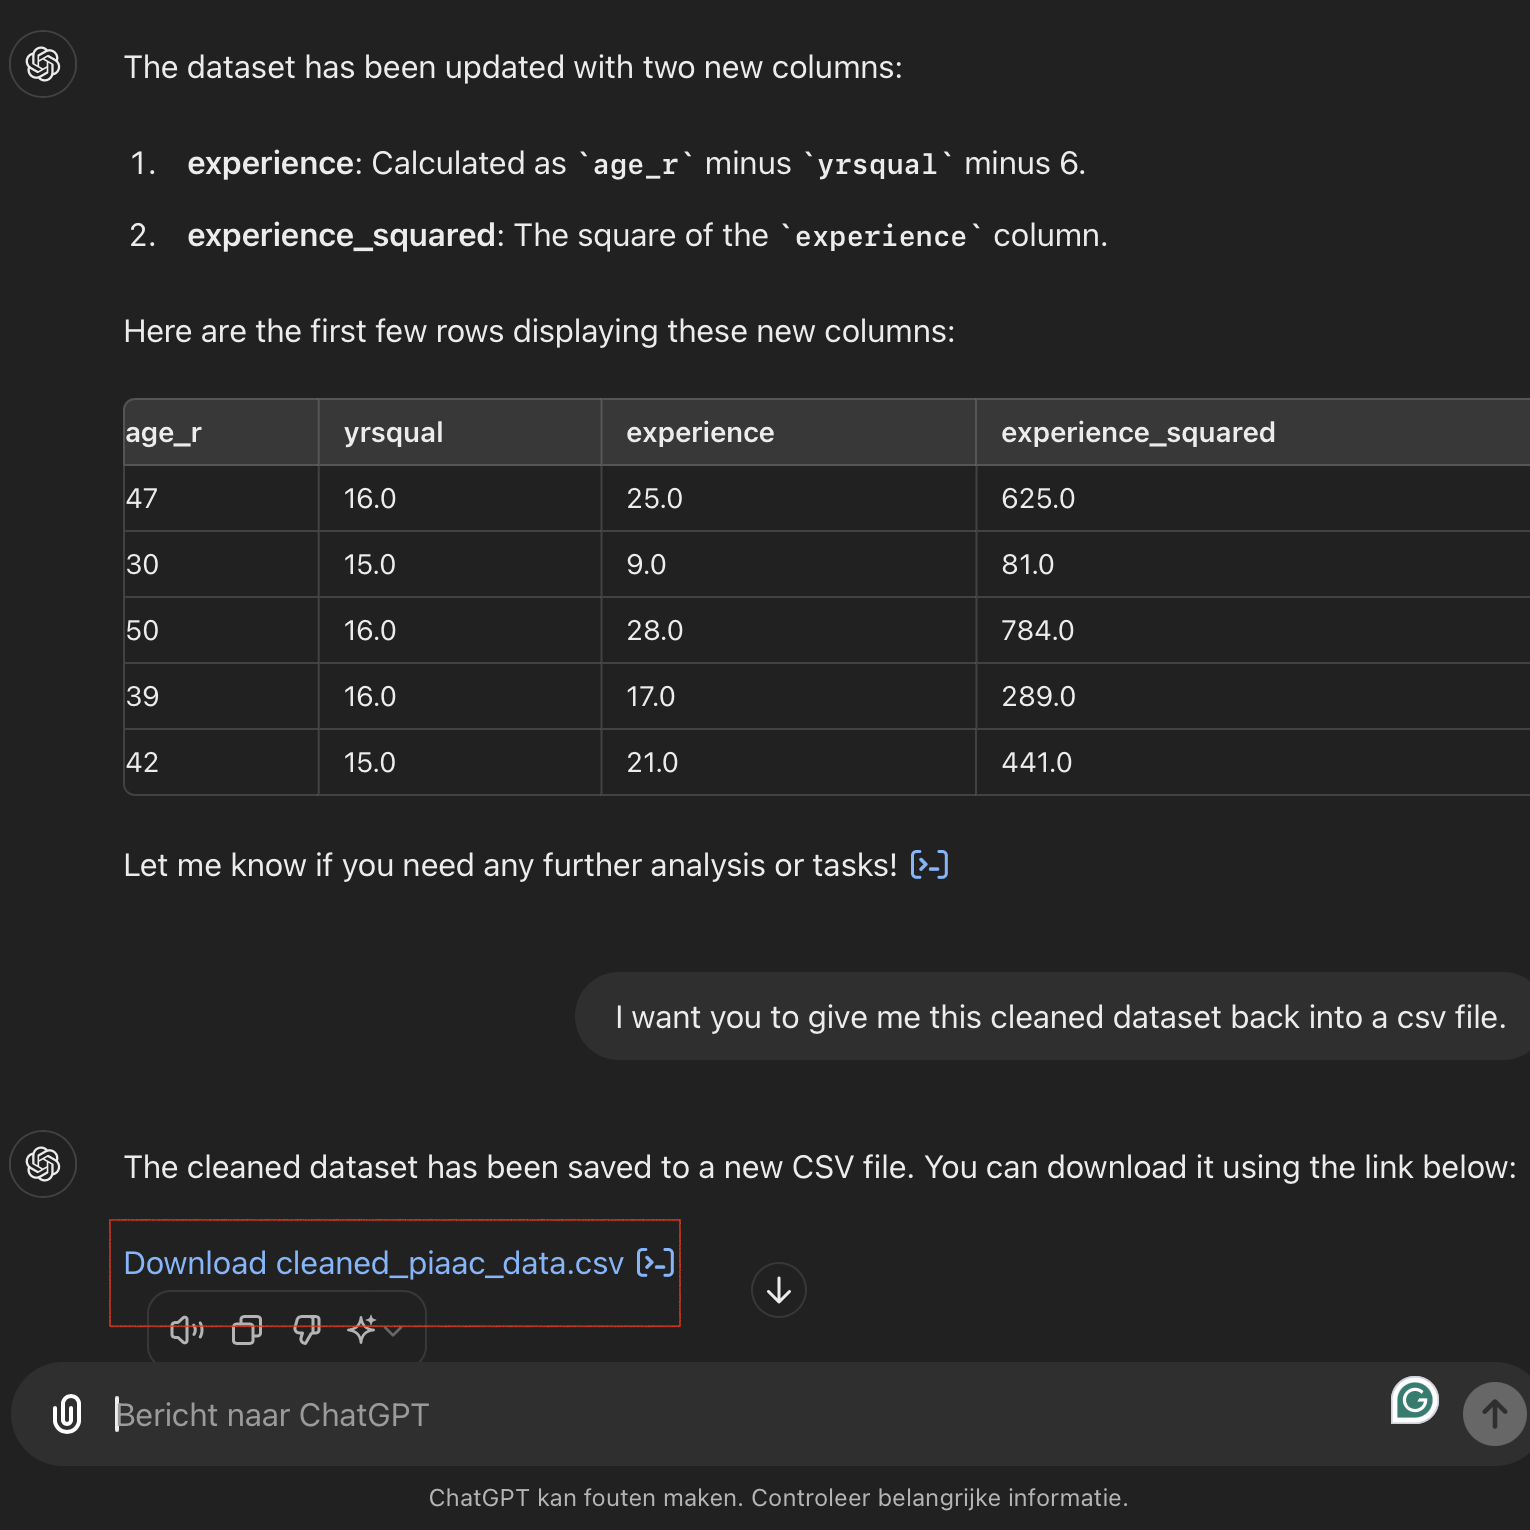
- Additionally, create two new columns. The first column should be named
experience, which is calculated by subtracting the yrsqual column and 6 from the age_r column. The second column,experience_squaredis simply the square of the values in the ‘experience’ column.
As a final step, we can save the cleaned dataset. Ask this to ChatGPT, but make sure to specify in what format you want to receive the data. Our prompt: Please return the cleaned dataset to me in a CSV file.
Exploration And Visualization
While it might seem like cleaning the data is the end of your interaction with ChatGPT, it’s actually just the beginning of the next phase of your data project. In this stage, you’ll be extracting insights from your data. This could involve calculating summary statistics or answering key questions within the dataset. There are two initial approaches you can take:
- Let ChatGPT analyze the dataset
- Specify to ChatGPT how it should analyze the dataset
Let ChatGPT analyze the dataset
If you’re unfamiliar with the data and don’t have specific research questions. Use the basis prompt again and let ChatGPT’s Code Interpreter analyze the data to generate relevant questions. For example:
I want you to act as a data analyst. You are performing data analysis on the PIAAC dataset. Perform the following tasks:
   1. Provide at least 5 questions we should investigate to better understand the dataset.
   2. Do not perform any data analysis without further instructions and my approval of the questions.
Next, you iterate on the ideas that ChatGPT’s provides.
Example Case: Specify What to Analyze
In our example, we will skip the basic prompt and move directly to the questions we have already formulated. Note that we will continue the conversation in the chat interface from where we left off in step 1.
We specified the following prompts and received the following output:
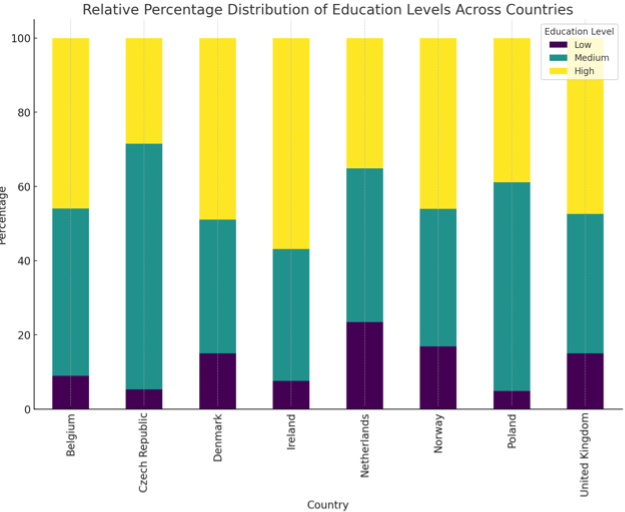
Prompt: Create a bar chart displaying the relative percentage distribution of each education level (Low, Medium, High) across various countries.
Our prompt includes the following components:
- Type of visualization: Bar Chart
- Specific type of bar chart: Relative percentage distribution
- Variables and their values: Education levels (Low, Medium, High)
- Grouping: By countries
Prompt: Create a summary statistics table to compare education levels across different countries in the sample. The table includes the average score for education levels (Low = 0, Medium = 1, High = 2), the median, mean, and standard deviation (SD) of these scores, as well as the ranking based on the mean. Additionally, the table shows the average years of schooling for each country.
Our prompt includes the following components:
- Type of visualization: Summary statistics table
- Specific metrics:
- Average score for education levels (Low = 0, Medium = 1, High = 2)
- Median of education levels
- Mean of education levels
- Standard deviation (SD) of education levels
- Ranking based on the mean
- Average years of schooling for each country
- Variables:
- Education levels (Low = 0, Medium = 1, High = 2)
- Years of schooling
- Grouping: By countries
| cntryid | avg_edlevel | median_edlevel | mean_edlevel | sd_edlevel | avg_yearsqual | rank_mean_edlevel |
| Ireland | 1.4925233644859812 | 2.0 | 1.4925233644859812 | 0.63440414403373 | 16.30700934579439 | 1.0 |
| Belgium | 1.369937369519833 | 1.0 | 1.369937369519833 | 0.6424926300756422 | 13.217482225010455 | 2.0 |
| Poland | 1.3396656534954408 | 1.0 | 1.3396656534954408 | 0.5678377593407595 | 13.72340425531915 | 3.0 |
| Denmark | 1.3394879369768586 | 1.0 | 1.3394879369768586 | 0.7240284670545553 | 13.443870014771049 | 4.0 |
| United Kingdom | 1.3239669421487603 | 1.0 | 1.3239669421487603 | 0.7207560055262129 | 13.536314229249012 | 5.0 |
| Norway | 1.2916232186305179 | 1.0 | 1.2916232186305179 | 0.7379839751344769 | 14.675938803894297 | 6.0 |
| Czech Republic | 1.2321598477640343 | 1.0 | 1.2321598477640343 | 0.5329263255713523 | 13.93767840152236 | 7.0 |
| Netherlands | 1.1171875 | 1.0 | 1.1171875 | 0.7565705643615195 | 13.609375 | 8.0 |
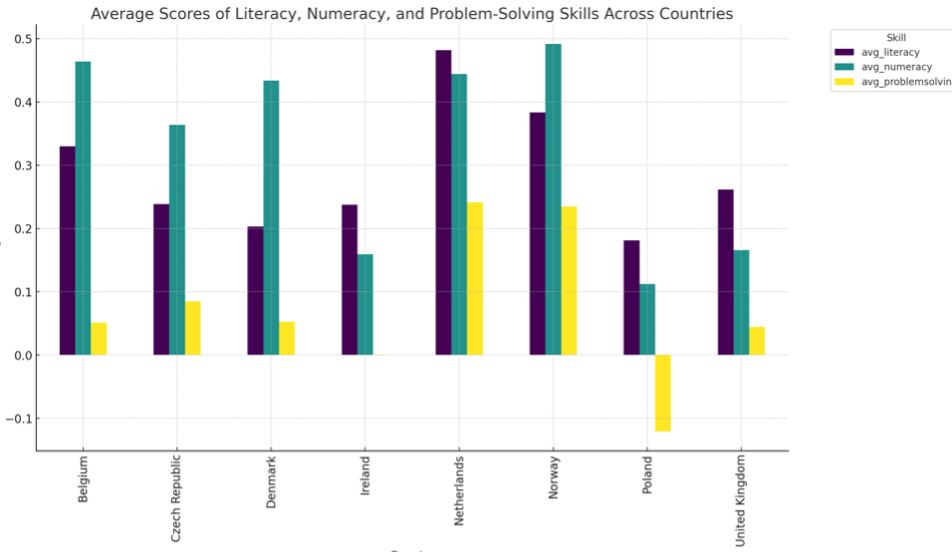
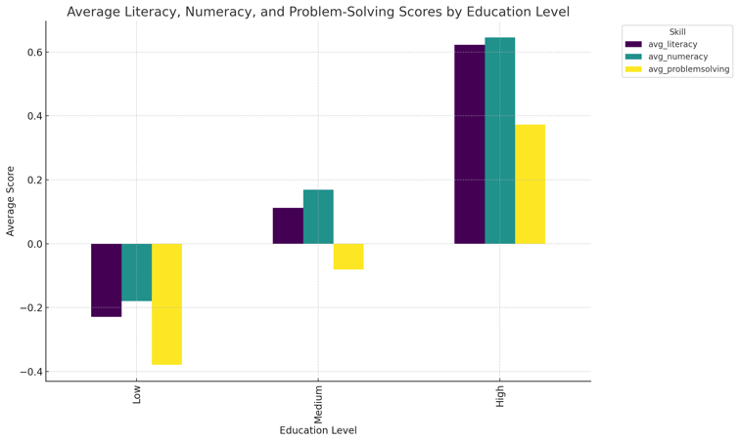
Prompt: Analyze the average scores of literacy, numeracy, and problem-solving skills across countries using a bar graph. This visualization compares the mean scores of each skill for different countries, highlighting variations in educational performance.
Our prompt includes the following components:
- Type of visualization: Bar graph
- Specific type of bar graph: Comparative bar graph of mean scores
- Variables:
- Literacy, Numeracy, Problem-solving
- Grouping:
- By countries
- Purpose:
- Highlight variations in educational performance across different countries
Specifying each component of the visualization is important. In our example cases, we allow ChatGPT to decide whether to include a legend and what the title should be. However, you can specify these details in your prompt. Remember, the more details you provide, the better ChatGPT understands your requirements. If the initial graph doesn’t meet your expectations, refine your prompt and specify the changes you want.
So far, we have only created very specific visualizations. Sometimes you might not have a clear idea and need some help. Simply ask the data analyst on duty:
Prompt: Generate more visualizations for insights.
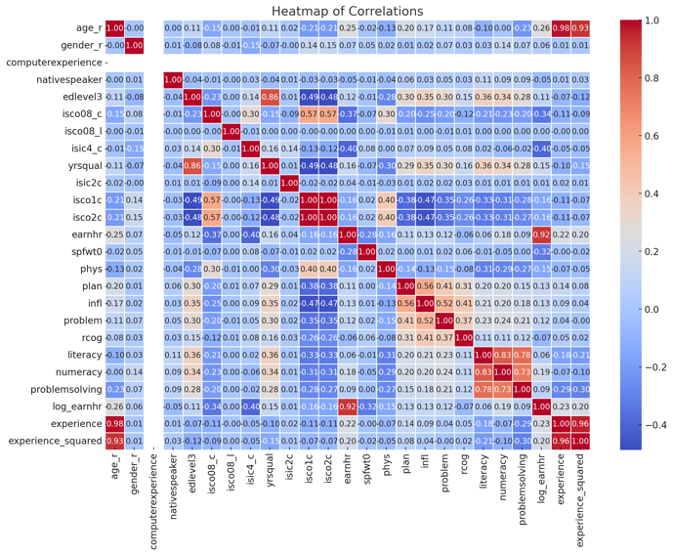
Prediction
Now that we have the clean data and a first impression of how the data is structured, and some initial look at correlations. It’s time to run some models. In this section, we will perform a regression analysis as an example.
Although the tutorial is designed to walk through all the steps without using a single line of code, this approach can be quite a black box regarding what happens to the data and is prone to errors. ChatGPT sometimes “hallicunates” (comes up with its own) data or forgets to add variables. Additionally, it struggles with more complex analyses, such as adding fixed effects. Therefore again: Always check the code of the analysis. Get an understanding of what ChatGPT does and whether it is correct.
Recommended is to open a new chat in ChatGPT for this step and performing the regressions there. Upload the cleaned dataset you downloaded earlier. As ChatGPT tends to “forget” earlier responses. Here is again the basic prompt to start with:
Act as a data analyst. Your task is to perform a statistical analysis. Conduct a regression analysis, on the cleaned dataset, where the dependent variable is the logarithm of the hourly wage, and the independent variables are experience, experience_squared, education level (edlevel3), native speaker status, and gender (gender_r). Include country fixed effects. Give me the following output specified within the placeholders.
< Report the regression equation, with an explanation >
< Report the estimated coefficients along with their standard errors >
< Explain and describe the relationships between the explanatory variables and the dependent variable >
< Comment on their statistical significance >
<The writing style and statistical rigor should match that of a master's level course in economics.>
Here is ChatGPT’s Response
What does this prompt specify? First of all, it meets all the requirements of our basic prompt. We ask our assistant to act as a data analyst, specify the task of running a statistical analysis, and narrow it down to a regression analysis. We explain clearly: what the y variable is, what the covariates are, and which fixed effects should be used. Additionally, we specify what output the model should provide within <>. Finally, we give them a task-specific setting, detailing how they should write it and how in-depth the analysis should be.
The basic prompt only provides general explanations. While informative, the real power lies in iterative prompts. Consider the following possibilities:
- Request a more detailed explanation:
- For example, about the relationships between specific variables and the dependent variable.
- Explanation of statistical measures:
- Such as the R-squared value.
- Identification of potential problems in your regression:
- Possible additional analyses:
- Conduct additional analyses to test the robustness of the results.
- For example, include interaction terms or examine the effects of different subsets of the data.
Although we have discussed that the code interpreter can perform statistical analyses, the “black box” nature of the tool raises significant concerns. This increases the risk of potential incorrect analyses or variations in ChatGPT’s responses to the same prompts. Therefore, we recommend conducting the analyses yourself using programming languages like R, Python, Stata, or Matlab. Afterward, upload a picture of the output along with the dataset and use the iterative prompts and some of the placeholders of the basis prompt to help you with the interpretation.
Data Storytelling and Communication
Now we have reached the conclusion, after our cleaning work, exploration, and analyses. Perhaps the most important part comes now: conveying the message to the reader. We already have our ingredients; we just need to tie everything together. Our goal is to create a clear and structured report. We can ask our data analyst to help with this, but we must provide clear instructions, which involves using placeholders.
Example Case
If you have opened a new chat, upload the visualizations from step 2 that you want to use in the report and specify that you want an interpretation of them. For our example prompt, we will continue with the regression analysis from the previous step.
I would like you now to create a report that contains the following:
< Short description of the dataset>
< The visualizations uploaded, with analyzation that should match a master’s level course >
< Statistical analysis, using the output of earlier. Use the following regression, the regression with the country fixed effects. Make use of your earlier output >
< Discuss the implications of other potential regressions, and if these regressions has been runned state the diverging conclusions out of it >
< Discuss potential issues about multicollinearity and causality >
< Conclusion >
Tailor the language you use for an master economics course.
Here is the report created by ChatGPT.
As you can see, our ChatGPT has put together a decent report. Of course, it is far from perfect. However, as often mentioned, this is a good starting point from which you can build your report. Focus on specific aspects that you want to explain further. Run a regression again or discover new potential issues in your regression with the output and adjust them. With some creativity and help from your data analyst, you can further expand the report. Naturally, you remain the expert on your own dataset, and you will have to understand the analyses yourself, fact-check, and verify what ChatGPT has provided.
As the cherry on top, you can ask ChatGPT for a PowerPoint, Word, or Excel document. However, to understand how it works, we recommend reading this article.