

Could you use some assistance with writing code in R?
Recently, our colleagues at Tilburg Science Hub published a really cool article about using GitHub Copilot for R. We have previously discussed setting up Copilot for Visual Studio Code, but we had not yet covered this feature. Knowing that many of you use R extensively during your studies or research, we thought it would be beneficial to share this article with you. Special thanks go to Tilburg Science Hub for sharing this article with us!
What is GitHub Copilot
GitHub Copilot is an AI pair programmer that offers autocomplete-style suggestions as you code. The tool can give you suggestions based on the code you want to use or by simply inquiring about what you want the code to do.
It is developed by GitHub in partnership with OpenAI, and it is designated to best assist developers in writing code more efficiently.
Some of its features include:
- Code autocompletion: generating suggestions while typing the code.
- Code generation: Copilot will use the context of the active document to generate suggestions for code that might be useful.
- Answering questions: it can also be used to ask simple questions while you are coding (e.g., “What is the definition of mean?”).
- Language support: supports multiple programming languages, including R, Python, SQL, HTML, and JavaScript. In this tutorial, we will be focusing on R.
Warning
Verified students, teachers, and maintainers of popular open-source projects on GitHub can use Copilot for Individuals for free. Otherwise, a paid subscription is needed to use the tool. For more information about billing, check out our article!
Set up GitHub and Copilot
- To start using Copilot in RStudio, you must first install R and RStudio on your computer. If you haven’t checked it out, Tilburg Science Hub has a building block on this: Installing R & RStudio.
- Once you have installed it, configure your GitHub account. To use Copilot in R you need an active GiHub account. A useful source is Set up Git and GitHub.
- As a student, you need to request specific access to use the service of Copilot. Follow this link. You will need to provide proof of enrollment.
- Once you land on the website, scroll down until you see this image:

- Click on “Get the Student Pack”. You will land on a page looking like this:

- Click on “Sign up for Student Developer Pack”, find the box indicating the benefits for individuals, and click on “Get student benefits”.

- Now, you will be directed to the page dedicated to your application. You will need to provide a valid University email address, the name of your institution, and a small motivation behind your request.
- Once you land on the website, scroll down until you see this image:
- Once your application has been approved, you will receive a notification via email (be careful; it could also be in the spam folder).
- To activate GitHub Copilot, go to the landing page of Copilot and make sure you are signed in with your GitHub account (the same with which you have requested the student access).
- Click on “Buy now”, then after that, a message should appear saying you are eligible to use Copilot for free. Proceed with installation, and there you go; you now have access to this feature.

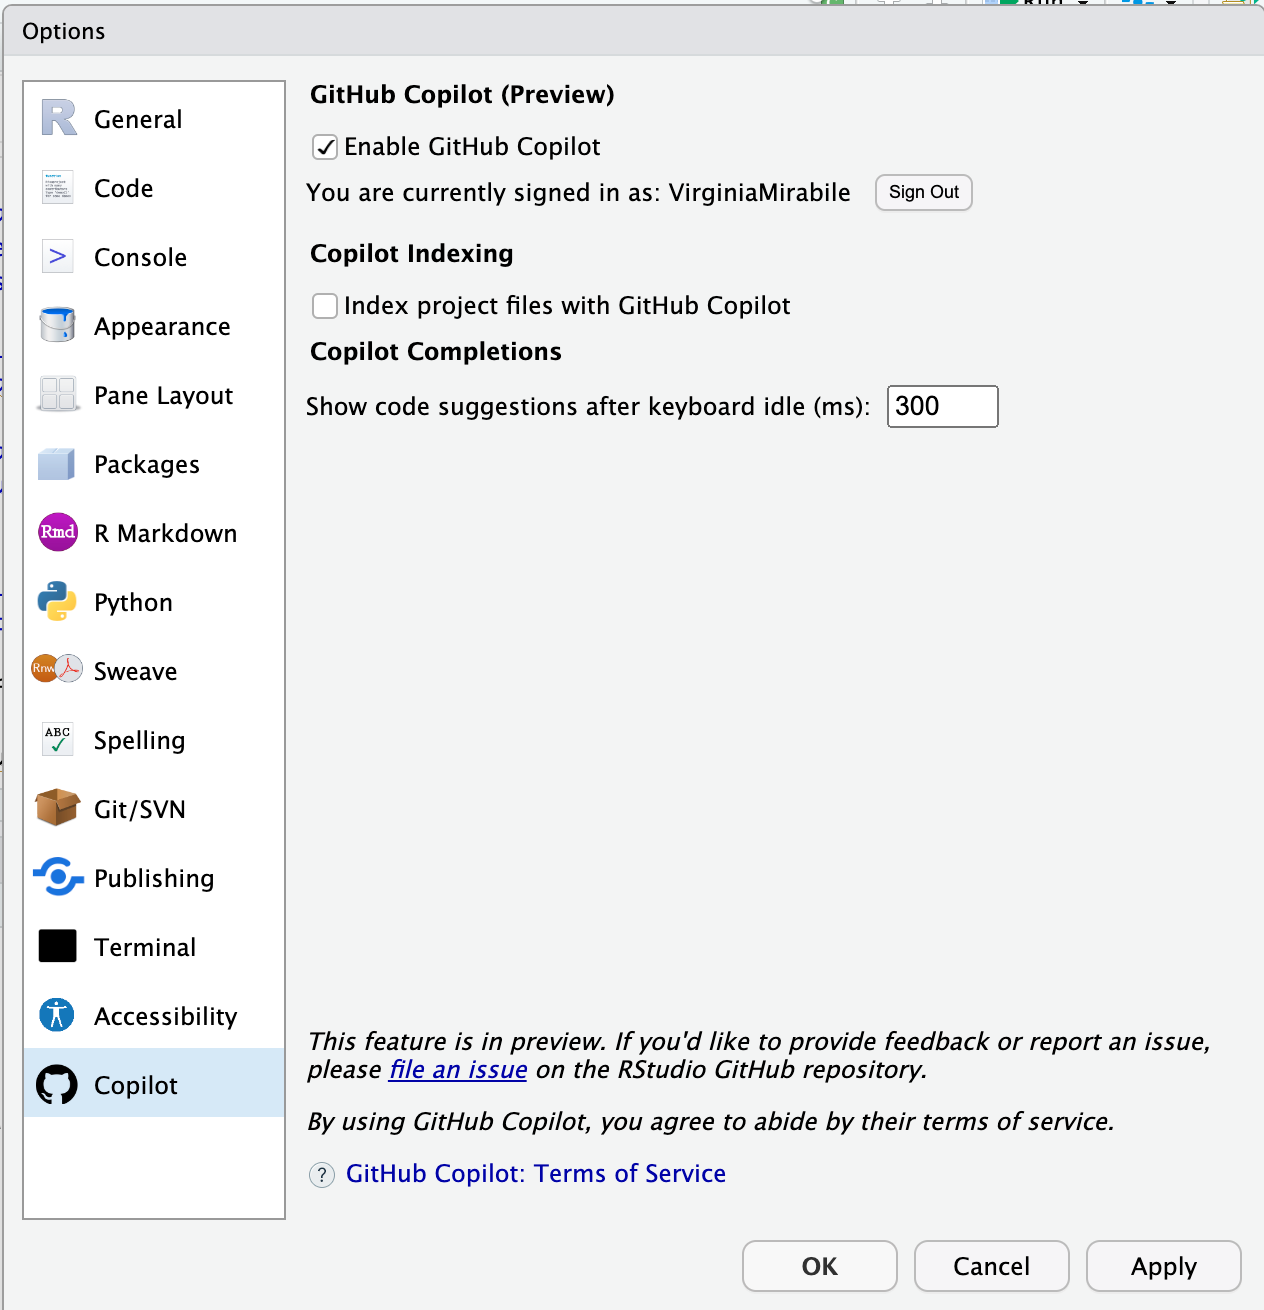
- The process does not end here. To enable Copilot in RStudio, follow these steps. Open the app, click on Tools -> Global Options -> Copilot -> tick the box saying “Enable GitHub Copilot” -> sign in to your GitHub account, and there you go; you are ready to start!
Applications
In this tutorial, we will see the application of Copilot in RStudio in the following contexts:
- Exploratory analysis of a dataset: simply tell R how to explore your dataset
- Data visualization: improve your plots instantly
- Data manipulation: use Copilot to save time on managing your data
- Questions & answers: Copilot also answers your (statistical) questions
Exploratory data analysis
For this tutorial, we will demonstrate the use of Copilot with the built-in R dataset called “swiss”, containing different socio-economic variables for different cantons in Switzerland.
As a first library, the package ggplot2 is needed for visualization and load of the dataset “swiss”.
# Load packages
library(ggplot2)

# Load swiss dataset
data("swiss")
Copilot will already start to give suggestions (as shown in the picture below); to follow those, you need to press the tab key.
Now, let’s proceed with exploring the dataset with some summary statistics. Again, notice that just by typing “Exploratory data analysis” in the R script, ghost suggestions will appear for the following steps. Such examples are the commands “summary” and “head”.
# Exploratory data analysis

# summary statistics
summary(swiss)
head(swiss)

# summary statistics on one variable (e.g., fertitlity)
mean(swiss$Fertility)
sd(swiss$Fertility)
To get the best output from Copilot, it’s important to keep your instructions simple. Remember, Copilot is still a new feature in RStudio and is continuously learning. Additionally, if you want to maintain Copilot’s momentum, just press the tab key on its previous suggestions to bring up more commands.
Tip
To get the best output from Copilot, it’s important to keep your instructions simple. Remember, Copilot is still a new feature in RStudio and is continuously learning. Additionally, if you want to maintain Copilot’s momentum, just press the tab key on its previous suggestions to bring up more commands.
Another useful way to use Copilot is simply writing what you want to do, and suggestions will appear accordingly. For example, if we want to know the summary statistics for two variables (e.g. fertility and education) and their correlation, write it in a comment format (using #) and Copilot will provide the code as shown below.
# summary statistics on two variables (e.g., fertility and education)
mean(swiss$Education)
sd(swiss$Education)

#plot the correlation between fertility and education
cor(swiss$Fertility, swiss$Education)
plot(swiss$Fertility, swiss$Education)
The resulting plot should look like this: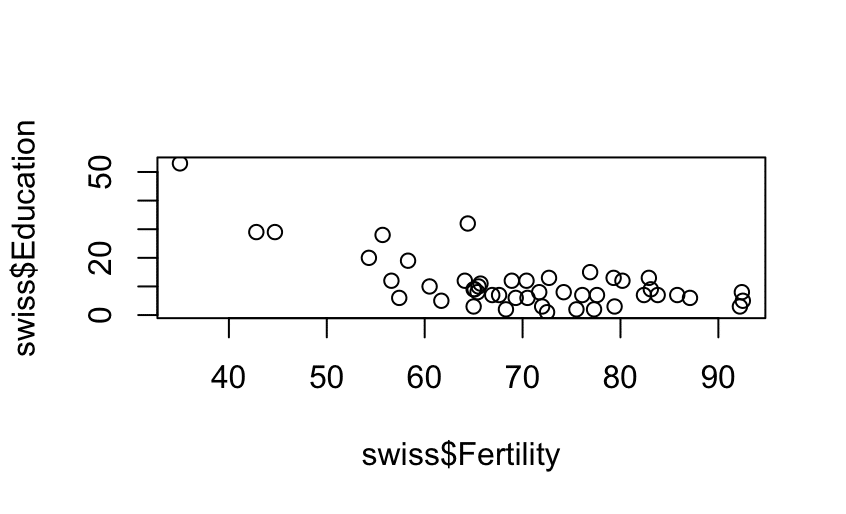
The scatterplot looks unrefined, but no worries, the following section will show you how to improve this with the help of Copilot.
Data visualization
A great advantage of using Copilot in RStudio is data visualization. With a simple request to Copilot, you can change the appearance of your visualization and implement small changes to elevate your graphs quickly. The first step is writing out in a comment form which variables you want to use and which figure you aim for. Copilot will suggest the simplest form of a graph; you can then proceed to refine the visualization to your best liking.
An example is the following suggested code:
# create a scatterplot between Fertility and Agriculture using ggplot2
ggplot(data = swiss, aes(x = Fertility, y = Agriculture)) + geom_point()
# improve the visualization, add a title, impose minimal setting and change the color of the point to a more neutral one
ggplot(data = swiss, aes(x = Fertility, y = Agriculture)) + geom_point(color = "grey") + theme_minimal() + labs(title = "Fertility and Agriculture in Switzerland")
# I want the dots to be blue
ggplot(data = swiss, aes(x = Fertility, y = Agriculture)) + geom_point(color = "blue") + theme_minimal() + labs(title = "Fertility and Agriculture in Switzerland")
# add the regression line to the plot
ggplot(data = swiss, aes(x = Fertility, y = Agriculture)) + geom_point(color = "blue") + theme_minimal() + labs(title = "Fertility and Agriculture in Switzerland") + geom_smooth(method = "lm", se = FALSE)
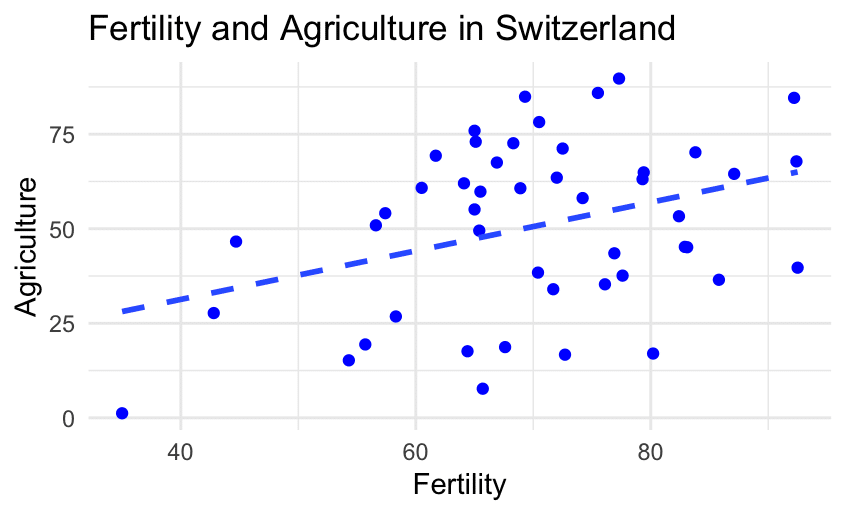
# make the line dashed
ggplot(data = swiss, aes(x = Fertility, y = Agriculture)) + geom_point(color = "blue") + theme_minimal() + labs(title = "Fertility and Agriculture in Switzerland") + geom_smooth(method = "lm", se = FALSE, linetype = "dashed")For your reference, a comparison between the starting and the final scatterplot: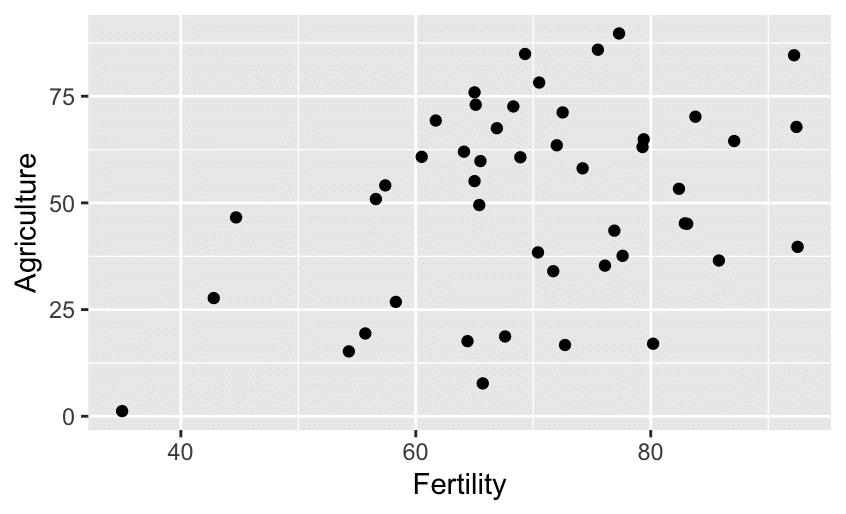
Data manipulation
In this case, the data manipulation consists of adding the cantons’ names as the first column instead of having them as indexes. This can be useful for performing a cluster analysis grouping cantons with similar socio-economic features.
In case you do not know how to proceed, you can ask Copilot how to do it, and it will give you input, as you can see in the code block below:
The following code block represents Copilot’s input. It could be possible that your suggestion will be different.
# I want to remove the index and add it as a column in the dataset. Suggest me a way to do it
swiss$Cantones <- rownames(swiss)
head(swiss)
After running this command, visualize the dataset. Notice that the cantons’ names were not removed as row names but added as the last column.
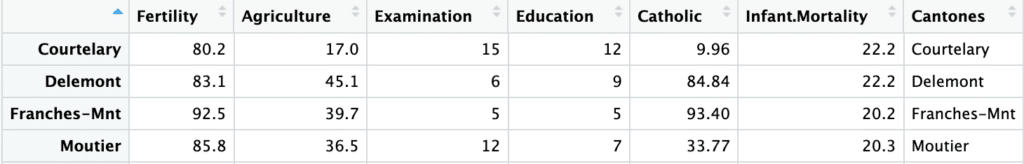
Although, in principle, this is not wrong, it doesn’t look very clear, and it would be better to have them in the first column for a clearer and more structured dataset.
After some research, one of the possible ways to do this is the following:
data("swiss")
library(tibble)
swiss <- as_tibble(swiss, rownames = "Cantons")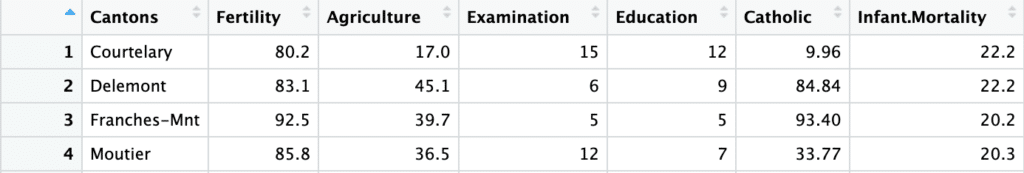
Tip
Before running the above code chunk re-load the “swiss” dataset to work on the original version, otherwise you will be running the code on the modified data.
Recall that, as every AI powered tool, GitHub Copilot is not to be followed blindly as it is constantly learning and can cause mistakes or not execute what you have in mind due to the phrasing of the request.
Questions & Answers
A nice feature of Copilot is the possibility to ask questions and receive a response on the RStudio script. A simple example is the following:
# You can also ask questions to Copilot.

# q: What is the definition of mean of a variable?
# a: The mean is the average of the numbers. It is easy to calculate: add up all the numbers, then divide by how many numbers there are. In other words, it is the sum divided by the count.
Summary
This tutorial provides an overview of GitHub Copilot and its application in RStudio for research purposes. It comprises three blocks:
- Explaining what GitHub Copilot is, its main features, and its applications.
- The setup process to ensure a smooth start with this new tool in RStudio.
- Demonstrations on how to use Copilot in RStudio.